 ) in the upper right hand corner.
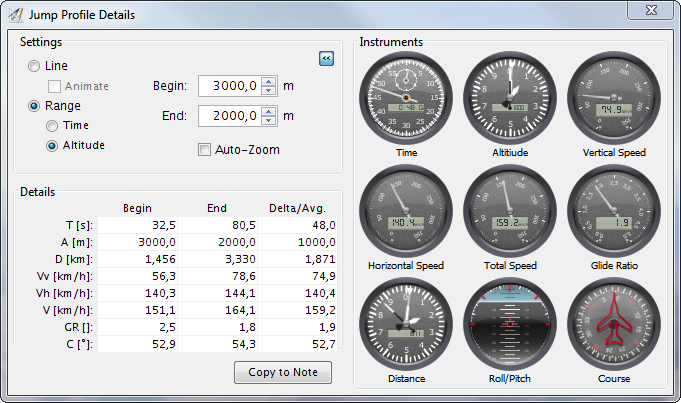
When the 'Line' cursior is selected, the instruments show the values for the 'Begin' column;
the values for the 'Delta/Avg' column, when the 'Range' cursor is selected.
) in the upper right hand corner.
When the 'Line' cursior is selected, the instruments show the values for the 'Begin' column;
the values for the 'Delta/Avg' column, when the 'Range' cursor is selected.When viewing a jump profile chart, click the 'Show Details' button in the lower right corner to see more details for this profile.
The controls in the upper left corner of this window allow you to control the type of cursor to be displayed: 'Line' shows a thin vertical line, while 'Range' marks a range on the chart, either along the 'Time' or the 'Altitude' axis.
The table in the lower half of the window then shows the data of the chart for both ends of the range and the difference/average between the two (When the line cursor is displayed, only one set of data is displayed). Clicking the 'Copy to Note' button will copy the data shown in this table can be copied to the note field of the jump.
Instruments to visualize the data can be shown or hidden with the small button
( ) in the upper right hand corner.
When the 'Line' cursior is selected, the instruments show the values for the 'Begin' column;
the values for the 'Delta/Avg' column, when the 'Range' cursor is selected.
The location of the cursor can be changed by changing the begin and end fields or by clicking (for the line cursor) or by pulling up a rectangle (for the range cursor) with the left mouse button and the CTRL key pressed. When the Video Player is showing, the position in the video will be synchronized to the current cursor position.
Delta/Avg. is calculated as
between 'Begin' and 'End' as marked by the cursors in the chart.
